You’ve likely seen a streamed pool match with Fargo Ratings in the bottom corners and a “chance to win from here” for each player that gets updated when the score changes. Where do these come from? Are they right? The answer to the second question is they generally are right. But there are limitations discussed toward the end of this contribution.
I’ll start with a story.
More than three years ago, when Fargo Ratings were new to the pool world, Shane Van Boening played Mike Dechaine a race-to-21 challenge match—The Tiger Challenge—at the BCAPL International event in Las Vegas. Adjacent to the playing arena was a giant screen, like the Ultrascreen at the movie theater, on which the players could not help but watch themselves live. For the first time, these things called Fargo Ratings were on the screen, and with a rating gap at the time of 39 points, poor Mr. Dechaine was forced to begin the match staring at this big 19% chance of winning the match. To make matters worse as he watched in horror, he actually had to watch himself watching.
 At a score of 4 to 4, Mr. Dechaine’s chances went up to 22%, and after winning the next game and leading in the match 5 to 4, Mr. Dechaine saw the high-water mark of 28%. A few games later, with a score of 7 to 8, the number was back to 19%, and then bad turned to worse. Following a 1% chance for Mike at a score of 13 to 19, Shane Van Boening finished off the match 21 to 13.
 As Mr. Dechaine began to walk away from the arena with his cue case on his shoulder, he got introduced to me, Mike Page. Mike Dechaine shook my hand, mustered a big smile, and said, “So YOU’RE the fu##er.”
For the record, Mike Dechaine beat Shane Van Boening later that week in the US Open 8-Ball event. He then also beat Shane the following month at Turning Stone. And, fittingly, he beat Shane 21-to-20 the month after that in a race-to-21 challenge match at Snookers in Providence RI. And because of these wins, Mike Dechaine is now the only player on Planet Earth with an overall winning record against Shane Van Boening.
You’re welcome Mike.
The rating gap between these two is now down to 21 points, and Mike Dechaine plays more pool than most people think.
So where do these numbers come from?
I’m not going to tell you yet because that involves math, and I don’t want you to stop reading.
Analysis of Turning Stone matches
A statistical statement, like outcome Y has a 30% chance of being realized, means if you were repeat the event many times, 30% is the proportion of times you’d see outcome Y. And that is the way to test these statements, by repeating the event many times. But of course we can’t ask SVB and MD to play a large number of races to 21 with a starting score of 9 to 13.
Here is an alternative. Jayson Shaw just a few days ago won his 6th Turning Stone Classic title. It turns out 178 of the matches from that event were played between two players both with established Fargo Rating. That’s not a BIG number for statistics. But it’s not chump change either. We sorted those matches according to the rating difference between the players and put them into four groups.
- Group A: 45 matches, rating dif. more than 100 points, average dif. of 156
- Group B: 55 matches, rating dif. between 50 and 100 points,
average dif. of 74 - Group C: 49 matches, rating dif. between 25 and 50 points, average dif. of 36
- Group D: 29 matches, rating dif. between 0 and 25 points, average dif. of 16
Take group B as an example. When a race-to-9 match has a rating difference of 74 points, the chance of the lower-rated player winning is 14% as shown on the calculator here.

Note you can in the calculator always just choose 74 and 0 as the two ratings, whether you’re talking about Denis Grabe (779) vs. Tommy Tokoph (704) or John Morra (786) vs. Joey Cicero (713) or Shane Van Boening (821) vs. Jeremy Sossei (748) or Jennifer Barretta (657) vs. Steve Sutton (583). It is only the rating difference that matters. The 14% prediction suggests 8 out of 55 matches would be upsets, would be won by the lower-rated player. The actual number was 9, including Tommy’s 9-to-7 win over Denis and Steve’s 9-to-6 win over Jennifer.
Group A contains the most lopsided matches, and with a rating difference of 156 points, the chance of the lower-rated player pulling it off is 1.4%, or an expectation of about 1 match out of 45. Turns out there were 2 upsets out of 45 matches, Jed Jecen (570)’s 9-to-5 win over Matt Krah (678) and Brent Boemmel (648)’s 9-to-5 win over Mika Immonen (785).
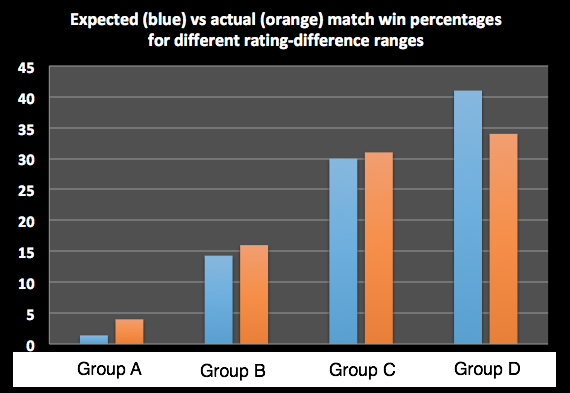
There are expected to be more upsets for group C, where the average rating difference is just 36 points. In fact 15 out of 49 matches (30%) are expected to be won by the lower-rated player, and 15 out of 49 is the exact number won by the lower-rated player. These include, as examples, Petri Makkonen (779)’s win over Jayson Shaw (816) and Danny Hewitt (755)’s win over Alex Kazakis (792).
The expected vs actual match win percentages for the four groups are compared in the graphic below. The agreement is as strong as can be expected for the modest numbers of trials.
Does FargoRate predict a match result?
It is tempting to look at an isolated match upset like any of the ones I mentioned above and say the FargoRate prediction was wrong. The irony there is if those upsets didn’t exist, that’s when FargoRate would be wrong. Those upsets are actually predicted to occur. FargoRate predictions are really about counting over many events, not about a single event. For those who play Blackjack, FargoRate should be viewed much as “the book” is viewed in Blackjack. “The book” doesn’t say you will lose the hand if you split your 10s or double your 8 against a 9. But it does say you will be worse off than making the alternate choice if you do it a lot.
When do the chance-of-winning-from-here predictions break down?
The predictions treat the individual games as independent events. This breaks down for winner-breaks format when the players have more than a modest chance of break and run. In other words, in situations where game “packages” such as 3-packs and 4-packs are frequent, chance-to-win-from-here will be unreliable.
Where do the chance-to-win-from-here numbers come from?
If you’re still here and you are finding this blog post interesting, please share it. And if you are allergic to math, you are dismissed. If you are generally comfortable with numbers or are feeling a little brave, please stick around.
Fargo Ratings—or more correctly Fargo Rating differences—give a chance of each player winning an individual game. If the rating difference is positive number D, then the chance the better player wins a single game is 1/(1+2^(-D/100)). For a rating difference D of 0, this gives 0.5 (half). For D of 100, it gives 0.667 (two thirds). For D of 200, it gives 0.8. In equations that involve this quantity, it is usually denoted “p.” So p is the probability the higher-rated player wins a single game. That means the probability the lower-rated player wins the game is 1-p. This is usually called “q.” So p + q = 1. Every prediction using Fargo Ratings is just propagating p through various scenarios.
The chance of winning a single game, a race-to-1, is just p (or 100Xp if you like percentages).
Things already get sneakily tricky when you consider a race to 2. It seems like you can win a race to 2 two ways, by a score of 2-to-0 or by a score of 2-to-1. But there are actually three ways: (1) you win the first two games, (2) you lose the first game and win the next 2, and (3) you win the first, lose the second, and win the third. These look like
- WW (probability pXp)
- LWW (probability qXpXp)
- WLW (probability pXqXp)
The probability of WW is pXp. This is where the assumption of games being independent events comes in. Probability of two things happening is only the product of the individual probabilities if the events don’t depend on each other. Note that the two ways of achieving a score of 2-to-1 each have the same probability, pXpXq, or p^2Xq. So when you add up the probabilities for the three scenarios, you can just consider it p^2 multiplied by 1 plus p^2Xq multiplied by 2.
Other races
For a race to 9, like at Turning Stone, a match can be won with a score of 9-to-0, 9-to-1, and so forth up to 9-to-8. The chance of the higher-rated player winning the match is the sum of the chances of winning by each individual score. And in each case, a particular specific outcome leading to 9-to-n has a probability of p^9Xq^n and this must be multiplied by the number of ways that score can be achieved. The 9-to-0 case is easy. The only way is the first player won 9 games in a row. For the 9-to-1 score, there are 9 ways to achieve it. The losing player could have won any of the first 9 games. Beyond that, the numbers get bigger fast. The number of ways to achieve 9-to-3 is 165, 9-to-5 is 1287, and 9-to-7 is 6435. This last number is combinatorial(9+7-1,7).
What about the “from here” part?
It is the same calculation. If you are down 6-to-4 in a race to 9, you must win 5 games before your opponent wins 3. This is the same as winning 5-to-0, 5-to-1, or 5-to-2 from here.