New England 9-Ball Series
We examine here the results of over 5,000 pool games played in the New England 9-Ball Series between two players each with an established Fargo Rating (rating based on 200 or more games). These numbers are large enough to make meaningful comparisons between expected results and actual results. We’ll get to the comparison shortly. But first, some perspective.
Open tournaments – no handicaps?
There are good reasons to NOT handicap tournaments. Chief among them is the purpose of competition, outside of amusing ourselves or others, is to see who is better. There are many examples of successful non-handicapped tournament tours, like the Eurotour and The Joss Northeast 9-Ball Tour.
Modest handicaps?
Another class of tournament tour, of which the Mezz West 9-Ball Tour is a good example, reaches with an encouraging hand a little deeper into the pool of tournament players. Though developing players with a modest handicap as an incentive are pretty unlikely to finish high, a few with a little help may make it to the money rounds.
Room for something different?
The above approaches draw largely from players in the top 15% or so amongst tournament players by skill. Consider that 80% of the players who play pool competitively and who think about pool on their drive to work in the morning are rated in the 400s and 500s. So a different kind of tournament series, one that includes the top players but for which players in this latter group can be involved, can compete, and can even win, provides a nice complement to the others. It is also what makes the other tournaments become more popular and more competitive because it gets emerging players to meet and interact with better players and see higher-level play up close. These tournaments fuel the progression.
Use Fargo Ratings to handicap?
The landscape for running highly-handicapped tournaments like this has traditionally been treacherous and filled with landmines due to the need to rate players. Fargo Ratings take the burden off the promoter and provide a vehicle to mold the tournament matches according to a predetermined vision. The approach we’ll talk about here is FargoRate HOT handicaps using Chart R6. Here the match two players play depends only on the rating difference between the players.
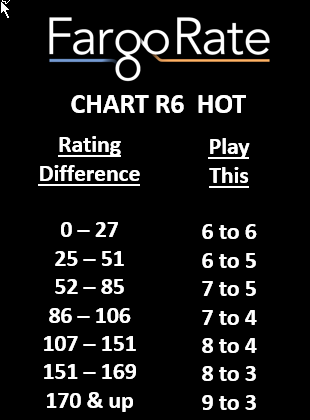
These matches generally give a small advantage to the higher-rated player. Take as an example the 7-to-4 match. This is used when the rating difference is anywhere between 86 points and 106 points. A typical 7-to-4 match will have a rating difference in the middle of this range, i.e., 96 points. At that rating difference, the higher-rated and lower-rated players have a 55% and 45% chance respectively of winning the match. This—a modest advantage to the higher-rated player-- is typical of HOT-R6. There are also MEDIUM and MILD charts that work similarly but have less aggressive handicaps.
New England 9-Ball Series Range of Player Skill
The New England 9-Ball Series run by MD Promotions is in its 16th year and now uses Fargo Ratings to handicap matches. The tournaments typically have an upper bracket using HOT-R6, a lower bracket using HOT-R5, and then bring the top players from each group together in the end. Not all players have an established Fargo Rating. Unestablished players play by a preliminary rating that includes an approximate translation of the old subjective letter rating to a Fargo-Rating equivalent. The analysis here includes only matches for which both players have an established Fargo Rating.
The range of player skills is remarkably broad. The highest and lowest rated players in this 359-player analysis list have ratings of 800 and 254, respectively. The average rating is 524. The average rating of the 36-player top 10% group is 661. The average rating of the 36-player bottom 10% group is 366.
Analysis: What to expect.
All games are grouped together according to the rating difference between the players. So, for example a 700 playing a 600 and a 500 playing a 400 are grouped together and labeled by the rating difference, i.e., labeled 100 points in this case. Then games are added up for all matches with a rating difference of around this value. The expected result with a rating difference of 100 points is that the higher-rated player wins twice as many games as the lower-rated player. So if the ratings are good, then the actual result should reflect this, like, for example something close to 300-to-150 or 450-to-225. If pairs of players with a rating difference of 100 points played matches that were 4-to-2, or 6-to-3, or 8-to-4, or 10-to-5, then in any of these cases about half the matches would be won by the higher-rated player and half by the lower-rated player.
As an interesting aside, we are accustomed to longer races favoring the higher-rated player, that an upset is more likely in a shorter race. Note that this thinking, which many of us have internalized, applies only to lopsided matches and doesn’t apply to fair matches. So, for example, a 600 wins occasional unhandicapped races to 4 against a 700 but almost never wins a race to 10. Things change when we compare a 4-to-2 race to a 10-to-5 race. Now these players split in the long haul either way. There is no race-length effect.
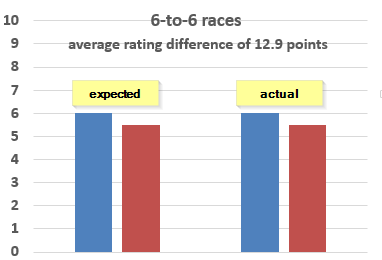
The 6-to-6 match: rating differences between 0 and 27
These are the even matches, the matches with no handicap. They include, as examples, Kerry McAuliffe (651) v Rob Piersa (650) and Jenn Brown (424) v Eric Newell (422). They also include matches lopsided up to 27 points, like Eli Davenport (484) v Lida Mullendore (457). There are 225 of these matches, 1800 games, with an average rating difference of 12.9 points. When the rating difference is 12.9 points, the higher-rated player is expected to win 52.2% of the games. The total games record should be about 940 to 860. In fact it is 943 to 857. So the higher-rated player won 52.4% of the games, quite close to the 52.2% expectation. The way we will display this is by noting that for each 6.0 games won by a higher-rated player, we expect 5.5 games to be won by a lower-rated player. And the observed results match this.
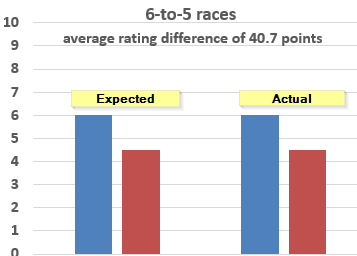
The 6-to-5 match: rating differences between 28 and 51
There 124 of these matches with an average rating difference of 40.7 points. Higher-rate player is expected to win 57.0% of the games, and the actual percentage is 57.3%. Expected and actual match scores are both 6-to-4.5, as shown here.
7-to-5, 7-to-4, 8-to-4, 8-to-3, and 9-to-3 matches
This high level of agreement between expected and observed results continues in the more lopsided matches.
- For 7-to-5, average rating difference of 67.0, expectation of 7-to-4.4; actual of 7-to-4.6.
- For 7-to-4, average rating difference of 96.2, expectation of 7-to-3.6; actual of 7-to-3.6.
- For 8-to-4, average rating difference of 126.4, expectation of 8-to-3.3; actual of 8-to-3.2.
- For 8-to-3, average rating difference of 161.9 expectation of 8-to-2.6; actual of 7-to-2.7.
- For 9-to-3, average rating difference of 201.9, expectation of 9-to-2.2; actual of 9-to-1.8.
Can C-Players give up 8-to-4?
One of the counterintuitive results of these analyses is that players rated under 500 can give spots like 8-to-4 and 8-to-3 and still retain the desired slight edge in the match. It is tough for some to wrap their heads around this in part because we are accustomed to the high numbers like 8 or 9 being associated with high-level play. Some imagine that winning an 8-to-3 match requires a few table runs and maybe even stringing a few racks together. Others imagine that the player going to 8 just can't make many mistakes. These thoughts are false. The player going to 8 generally can make the number of mistakes he usually makes in that number of games.
There are 10 matches in this analysis for which the higher-rated player is under 500 (average 474) and the lower-rated player is 110 or more points below (average rating of 344). For a 130-point gap, the expected game ratio is 8-to-3.2. The actual results for the 10 matches are in the ratio 8-to-2.8. The rating gap works the same in the vicinity of any skill level. That is a key feature of Fargo Ratings.
Data, Data, and more Data
The key to being able to run a high quality tournament tour like the New England 9-Ball Series using an approach like this is reliable ratings, and that comes from lots of data. While the tournaments themselves provide useful game data, relying solely on tournament data is a slow road. The real secret to getting a region firmly established and growing pool is league data. There is a tremendous benefit to the tournament scene from having reliable ratings even for league players who rarely or never enter tournaments. The reason is these players provide many strands in the web of connections between the tournament players.